Dashboard application
Use the dashboard to explore website traffic, acquisition, audience, events, and conversion funnels. It combines the library's reporting API with a ready-to-use interface.
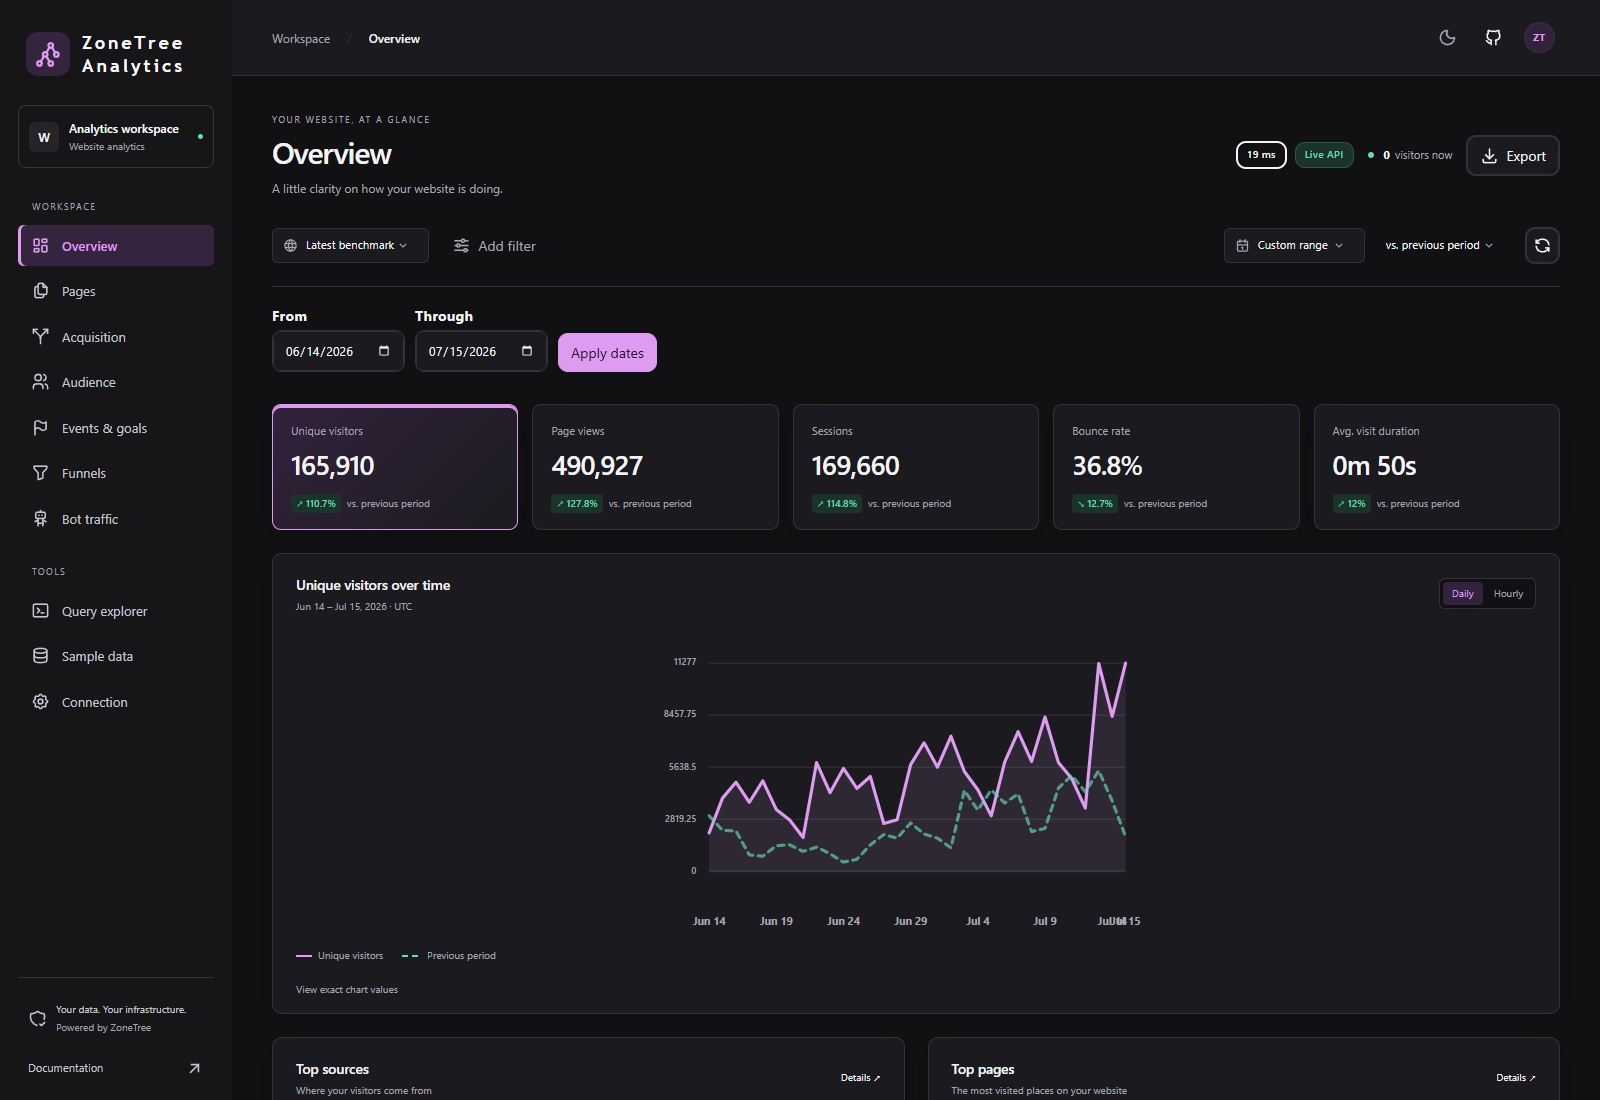
1. Run the dashboard
Install UI dependencies from the repository root:
cd apps/ZoneTree.Analytics.Dashboard/ui
yarn install
Then run the server from the repository root:
dotnet run --project apps/ZoneTree.Analytics.Dashboard/serverOpen http://127.0.0.1:5088/. The development profile starts the UI watcher automatically, so page and style changes update in the browser.
2. Connect your reports
The included server supplies API connection settings. To connect another reporting API, open Connection and choose its URL, sites, reporting time zone, and refresh interval.
The default reporting prefix is /_analytics/api. Site IDs in the dashboard must match those used to collect events.
3. Explore your data
| Page | Question |
|---|---|
| Overview | How are traffic and engagement changing? |
| Pages | Which content attracts visitors? |
| Acquisition | Which sources and campaigns bring traffic? |
| Audience | Where do visitors come from, and how do they browse? |
| Events and goals | Which actions and conversions happen? |
| Funnels | Where do visitors stop before completing a goal? |
| Bot traffic | Which automated clients visit? |
| Query explorer | What does a custom report reveal? |
Choose a site and date range, then add filters or comparisons to explore a specific audience. Export reports when you need to work with the results elsewhere.
4. Try sample datasets
In Development mode, open Tools → Sample data to generate reporting data or run an ingestion benchmark.
| Dataset | Purpose |
|---|---|
| Default site | Traffic collected by the running application |
| Performance samples | Generated traffic for exploring report behavior |
| Latest benchmark | The retained dataset from a successful ingestion benchmark |
Sample tools operate on their own datasets. They do not replace your primary traffic. The latest successful benchmark remains available after restarting the host.
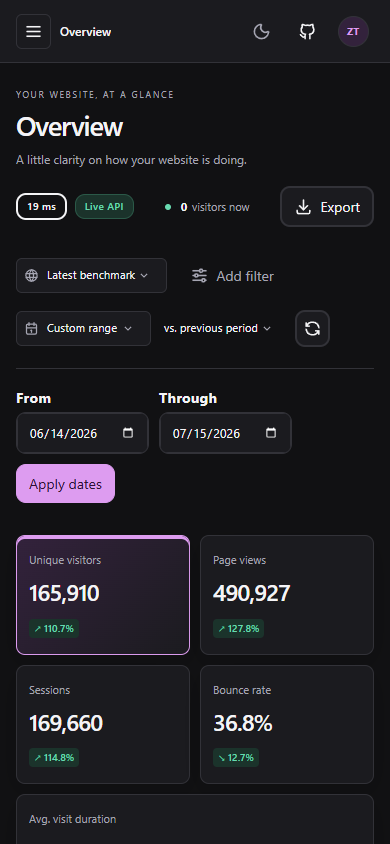
Interface technology
PureStack generates the dashboard's pages and provides shared layouts, themes, and UI components. Regor powers reports, filters, and charts, with an independent application on each page. See the technology stack for how the interface connects to the .NET engine.
Deploy the dashboard
Generate the static UI:
cd apps/ZoneTree.Analytics.Dashboard/ui
yarn publish
The server serves the published output from ui/dist/publish. Use Dashboard:Watch=false for static serving in Development, or Dashboard:Path for another output directory.
The application listens on all network interfaces by default. Apply your host's authorization policy before giving others access to reports.
Shared engine settings live in DashboardAnalyticsOptions.cs. Its settings apply to the primary, sample, and benchmark engines, and differ from the library defaults. See configuration before changing an existing dataset.